12 Key Metrics for Online Marketplace: How to Track Your Business Growth

In order to boost the e-commerce business, making high-quality software isn’t enough. If you want a marketplace to be thriving, you need to track marketplace metrics that go far beyond the visitors and transaction figures.
Read also: How to Build a Two-Sided Marketplace
In this write-up, we’ll go into success estimation and the key marketplace metrics that are to be noticed when you deal with marketplace analytics. Comprehending these metrics for marketplace companies will set the direction to adjust platform health and form an opinion of future perspectives.
Marketplace Metrics Reflecting Usage
Let’s get underway of this marketplace metrics guide with the most commonly measured KPIs—usage metrics. They bring data on visitor numbers and their experience on the platform. Let’s touch on three:
Monthly Active Users (MAU)
MAU is the number of individuals who have dropped by the marketplace. A positive marketplace startup metric shows growth. if it remains on the same level, it’s writing on the wall. This can happen due to two reasons:
- User outflow exceeds newcomers' attraction.
- New visitors are not coming.
Bounce Rate
The new user’s flow-in does a good thing but hold on a second and let me tell you something. Tons of non-interacting users aren’t a metric to outline progress. The bounce metric measures the share of immediate-to-leave guests.
Platform Presence Duration
If people remain on the platform, the duration is the primary key metric to track for marketplaces. The presentence duration shouldn't last. Otherwise, it may indicate complex navigation and difficulties in finding a needed item. In lieu, if users stay longer, they tend to purchase more. Extra analyses are required to puzzle out the reason for the long presence.
These metrics are not just retail marketplace success metrics but they're aimed to estimate the performance of any development. They are of much greater importance when dealing with social networks. Inherent to e-commerce marketplace metrics are the next topic of discussion.
Transaction-Related Key Marketplace Metrics
When talking about metrics reflecting transactions, it’s natural to think, that transaction figures determine marketplace lucrativeness. There is more to it than meets the eye.
- Liquidity
Liquidity is a share of shoppers that found what they were looking for and eventually made transactions. It drives your marketplace and reveals how well the marketplace solves its challenge of matching suppliers and consumers.
If we’re talking about b2b marketplace metrics, liquidity exists in two forms:
Supplier liquidity is measured as the portion of items transacted. It’s the listings divided by transactions.
Consumer liquidity is the share of visits ended in transactions. It is the visits divided by the transactions. Note: the bounced visitors are not counted.
- Buyer/Seller Ratio
The Buyer/seller ratio shows whether the number of one role prevails over the other. There’s no exact ratio value that can be applied to all marketplaces, as it leans on both the listing type and purchase frequency. For some, 1:1 is a ratio of flourishing b2b marketplace metrics but for other industries, the ratio of 1:50 may be required. By the way, this is Uber's ratio and means that 1 driver gives a lift to 50 passengers daily.
The most reasonable practice is to define the metric as the ratio of supplier transactions average to consumer transactions average.
A vendor is looking for bringing more trades. So, It’s a wise move to direct attention to provider investment at the start. Here’s why: If a seller can’t find demand for their item on your marketplace, they can list on another platform but still be likely to get back. Conversely, if a buyer encounters the searched supply in another marketplace, the chances of getting them back are greatly lower.
But if your buyer/seller ratio soars, it implies that the suppliers exceed the demand. In this regard, speeding up demand attraction is a way out.
- Repeat Purchase Ratio
It is one of the core marketplace metrics that refers to the share of transactions repeated by people who have already made purchases on your marketplace. If the ratio is low, hard times can break your marketplace up. How does it work? If most customers appear to make only one transaction, then it's likely they're not getting the value they need. Repeated purchases contribute to a larger budget endued on purchaser acquisition, as they tend to bring multiple trade deals.
So, we have delved into the user and marketplace dynamics metrics. There are metrics that are to be considered when determining the marketplace boom - marketplace business metrics.
Core Marketplace Business Metrics
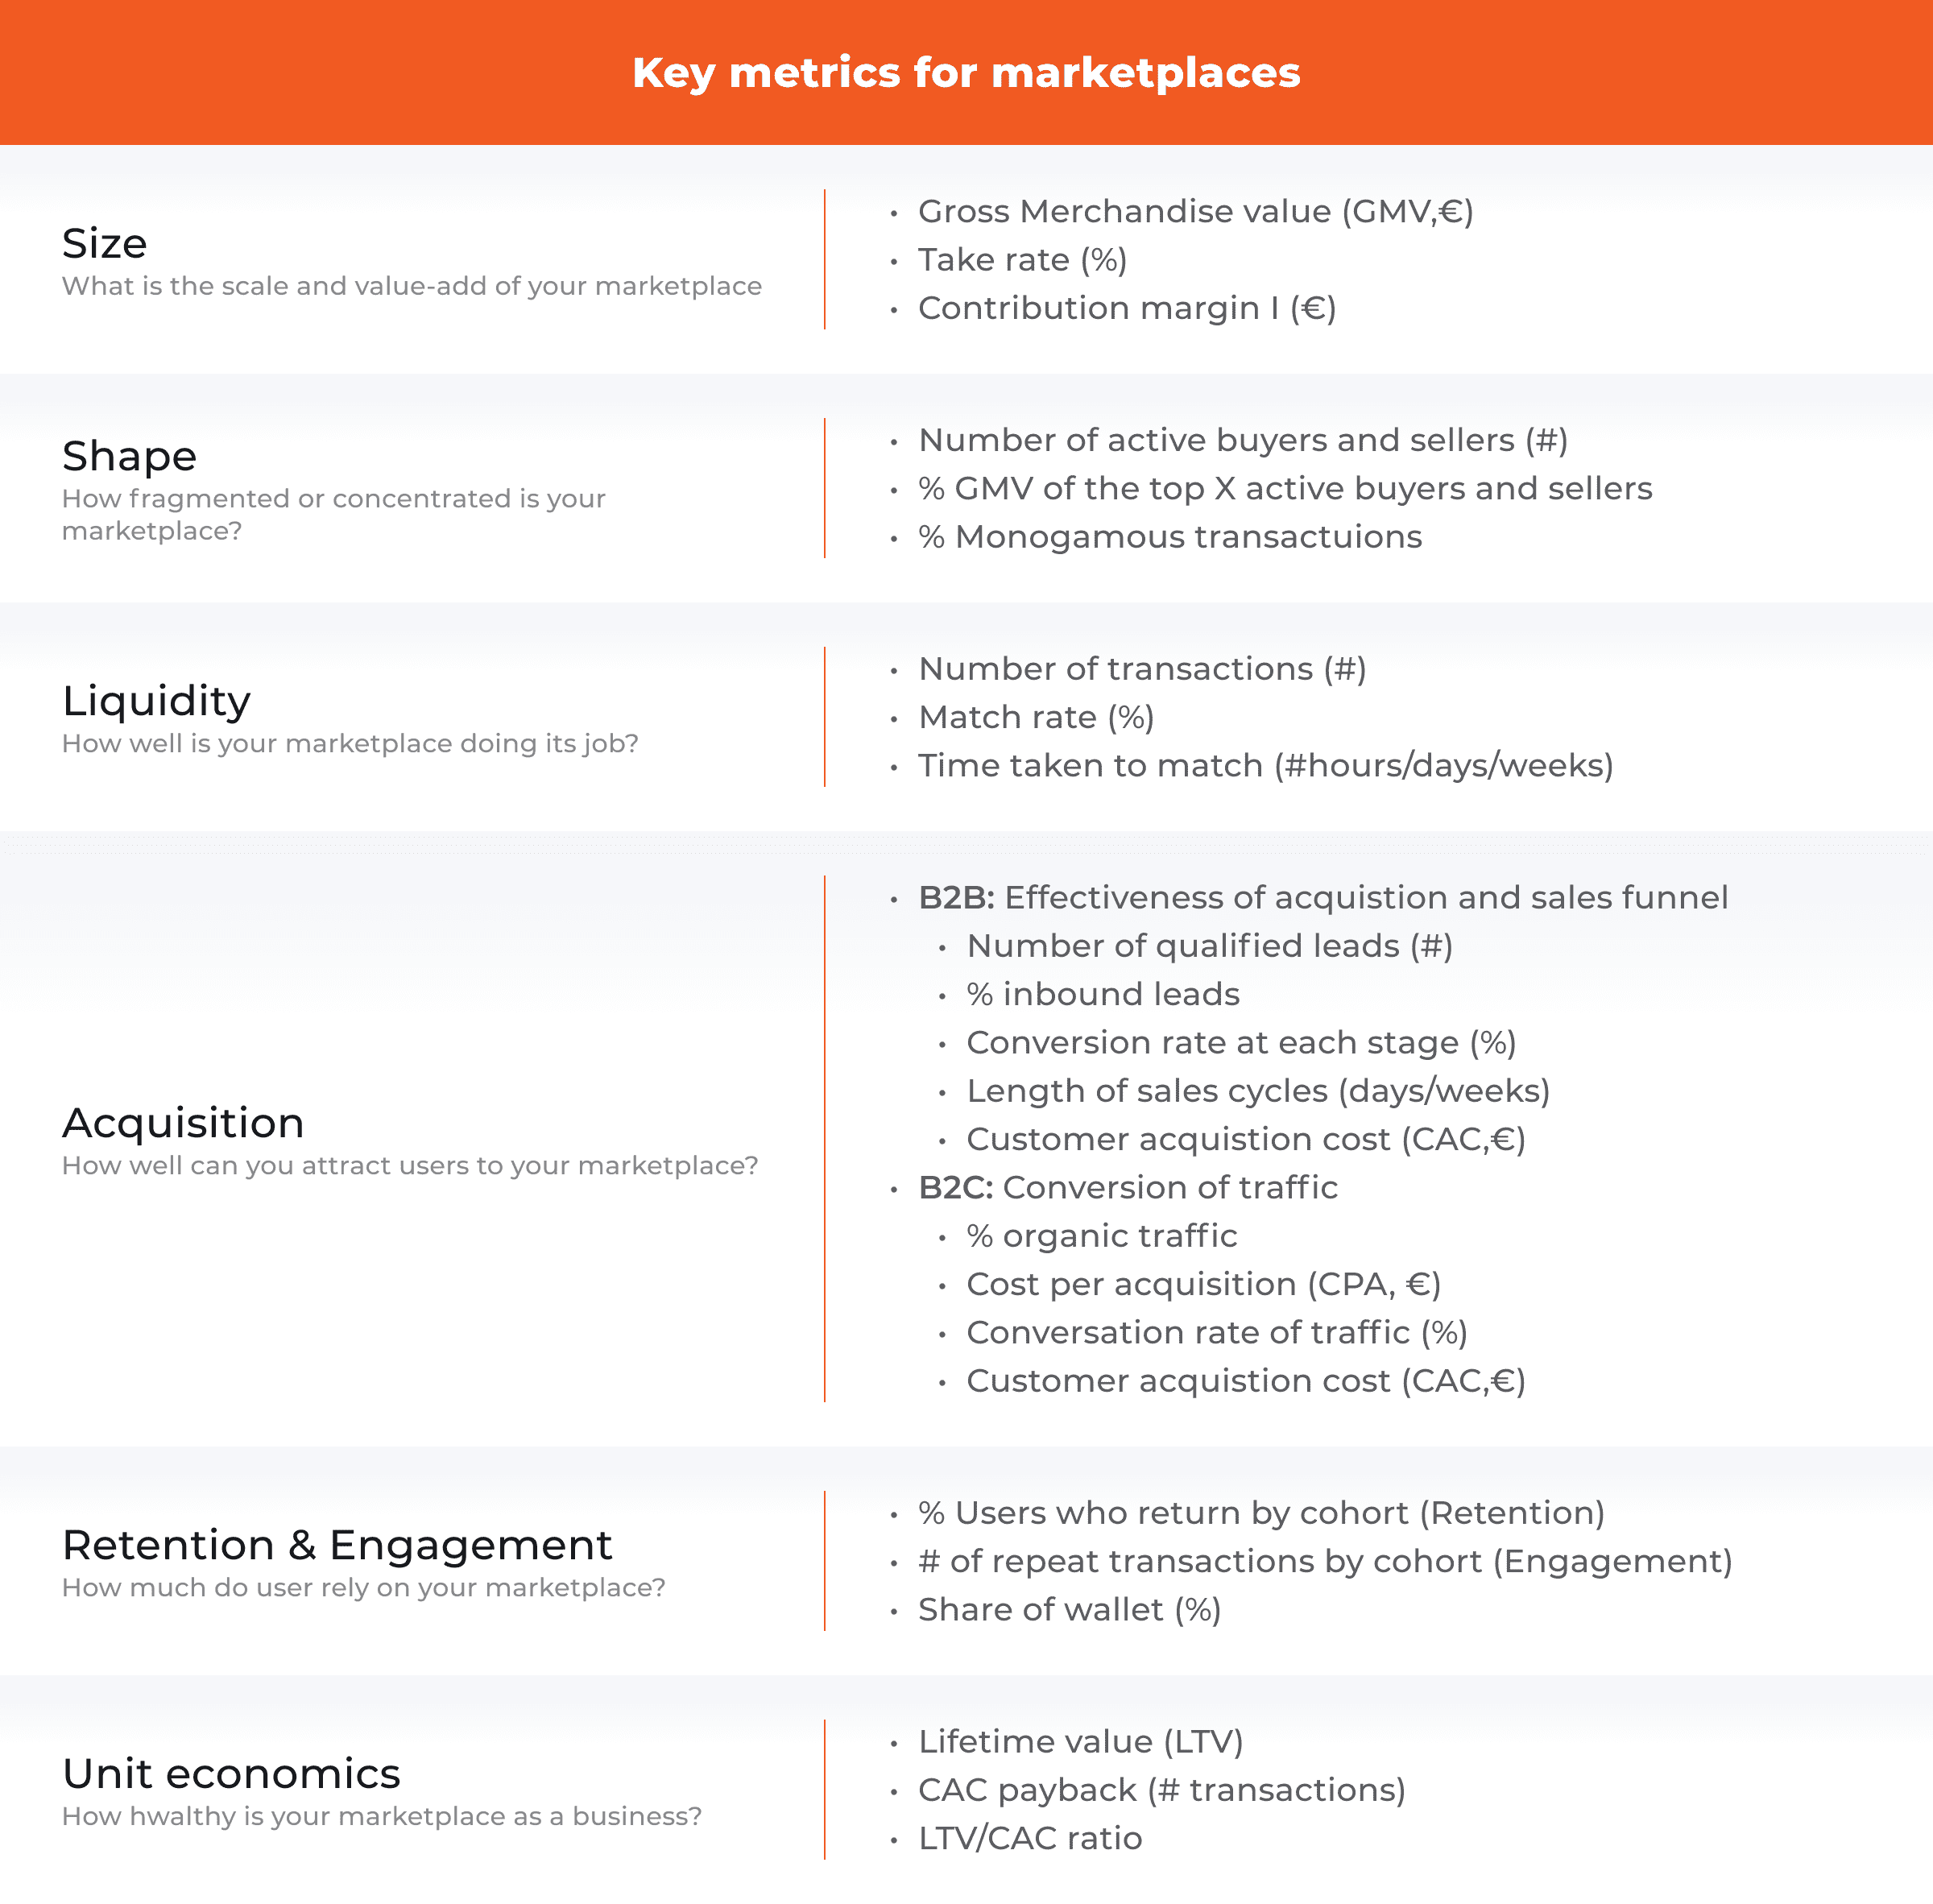
Business startups' marketplace metrics are vital when reporting a marketplace prospering. These KPIs are designed for earnings, advantages, and user acquisition pursuit. Our guide includes three: gross merchandise volume, customer acquisition cost, and customer lifetime value.
- Gross Merchandise Volume (GMV)
Gross merchandise volume is referred to as the total sale of a listed product/service traded via the marketplace. If you're concerned about marketplace size, this metric is enough. But size doesn’t mean prosperity. To determine how prosperous your marketplace business is, other KPIs are to be factored in.
Note: GMV doesn’t indicate income but it is used to calculate it. Multiplication of GMV by the take rate equals the total revenue value.
- Customer Acquisition Cost (CAC)
CAC reveals the cost to bring one consumer. The marketing, support, ads, and other expenses related to buyer acquisition are CAC. The lower the CAC, the better. The perfect situation is shaped when a buyer brings another buyer with creating an organic customer acquisition cycle that is free of your interference. Unfortunately, it’s unlikely to happen.
In measuring the marketplace progress, CAC goes together with CLV.
- Customer Lifetime Value (CLV)
CLV is expected gross profit from every buyer over their presence on the marketplace. The benefits of the CLV analysis:
- The rise in CLV value can pile up the revenue
- It spots the weak points. By eliminating them, the clients remain on the platform and are likely to become loyal.
- It can point out perfect clients.
- It facilitates the CAC chopping.
CLV pivots on the buyer retention period, the expected value of repeated transactions, and average transaction size. This dependence may make the calculations challenging.
GMV is divided by the monthly transaction number resulting in average order value (AOV). AOV multiplied by the number of the average purchases per customer equals CLV.

Other Important Marketplace Metrics
Marketing Customer Conversion Funnel
Conversion is the movement from one stage to another or a targeted action. Usually, the crucial conversion is the way that newcomers go through to purchase.
It's common to view the conversion from each step to the next. This is called a conversion funnel.
The customer conversion funnel includes several stages of decision-making:
I. Awareness Stage
A person simply looks for an item by using a search engine or navigates through the categories.
II. Consideration Stage
A customer may view some of the listings. If the goods and services aren’t the items they were looking for, they can go back to the search. Once the required listing is found, they go to the next stage.
III. Decision Stage
The visitor has viewed the options, and is ready to decide and click the “buy” button.
The funnel provides data on how things are going in your marketplace. It aids to detect the shortcomings where the users churn. Analyzing the conversion funnel, you can figure out what’s to be fine-tuned and pick the area to buckle down.
If the funnel shows a low visit rate, you should go the extra mile in user acquisition. The high bounce rate reveals an improper acquisition approach. Landing page enhancement or core value proposition fine-tune may become a solution.
Liquidity issues are seen when the users don’t bounce but don’t make their way up to the purchase. To solve this problem, you may narrow the marketplace niche or bump up the number of suppliers.
Stucking on the awareness stage, i.e., going through numerous listings without clicking the “buy” signals that quality optimization or fee reconsideration are required.
If a client has concluded on buying but is not going for payment, it’s time to review the transaction flow.
Retention & Engagement
Retention & Engagement are the online marketplace metrics illustrating how many users entrust your marketplace.
Retention is a cohort-based value that indicates the frequency of returns. For example, 12 customers made their first transaction in April. In May, 6 of them returned to transact again. And in June, 3 of them made a purchase. One-month retention is 50%, and two-month retention is 25%. Retention analysis helps to define what impacts the retention rate and purify the strategy to ensure higher retention.
Engagement shows how many times a retained customer repeats transactions by a certain time in their lifetime. To calculate engagement, cohort analyses are used, too.
As an online business entrepreneur, you would love your customers to return to transact and, by doing so, to make your marketplace to be the one where a specific category is shopped. In the beginning, the retention and engagement will be evened. But in the course of growth, the engagement is hoped to prevail.
Develop Your Own Online Marketplace Business with Celadon
Celadon is a full-cycle marketplace developer that will help you to explore unknown lands of marketplaces. We develop intuitive and user-friendly, scalable, quick-to-load, and bug-clear web and mobile marketplaces.
Our portfolio includes a great deal of marketplace case studies featuring jewelry marketplace development and construction services marketplace.
What makes us different from other developers? Our development process moves well beyond delivering a product but we also support and maintain the product. On request, we elaborate a marketing campaign and app store optimization.
Looking to develop a high-performance marketplace? Send us a brief message, sharing your idea, and will get in touch with you in no time.
Final Thoughts
We have gotten the hang of how we measure marketplace health by looking at the key marketplace metrics. Even though the marketplaces are vastly dissimilar, usage metrics, transaction metrics, Business metrics, customer conversion funnel, engagement, and retention form the list of must-to-analyze metrics that a marketplace owner should be not a stranger to.
Stay tuned for more interesting articles on our blog.