20 Mobile App Statistics to Know in 2020

Have always been curious about why people choose to use or, on the contrary, not to use a mobile app? Questioned yourself, what kind of app is the most popular one? Or just was wondering, how much time people spend on their gadgets?
We have some good news for you. Below there’s a piece of useful yet interesting data to look at. We’ve gathered 20 up-to-date stats about mobile usage and download, so you can check and make sure that the app you are developing goes perfectly along with the trends and fits activities your target audience performs in 2020.
Get right to it or skip and move to the section below.
- Mobile App Usage & Download Statistics
- Millennials & Gen Z App Usage Statistics
- Mobile App Revenue Statistics
Mobile App Usage & Download Statistics
We have collected the most up to date statistics about downloads habits, usage trends, and many more. The numbers not only reveal what is going on in the market but also show the psychological peculiarities of the users.
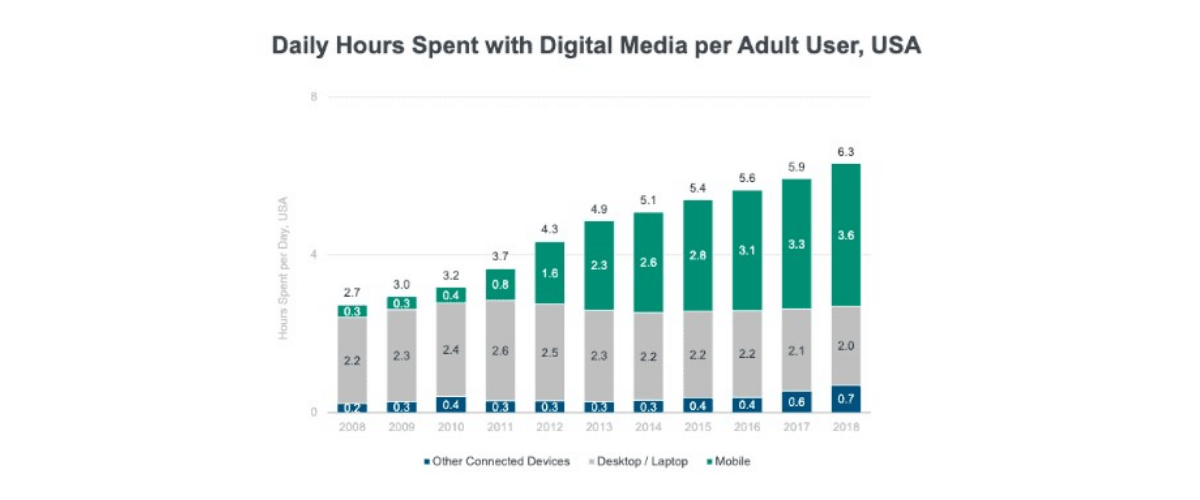
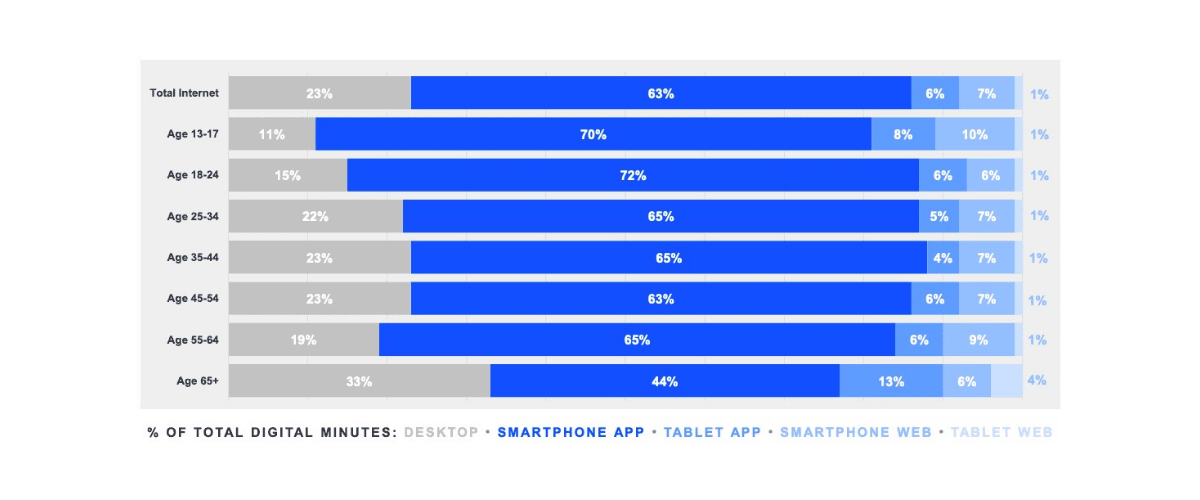
1. Mobile internet usage is rising and the one on the desktop is falling.
This statement is one of the key points in Mary Meeker’s 2019 report. In general internet usage is rising, but the gap between mobile and desktop becomes more and more significant. In 2018 USA users were spending almost 4 hours a day on mobile, which is 12 times more than the decade ago. For desktop, the figures were 2 hours per day and this number was consistent since 2008.
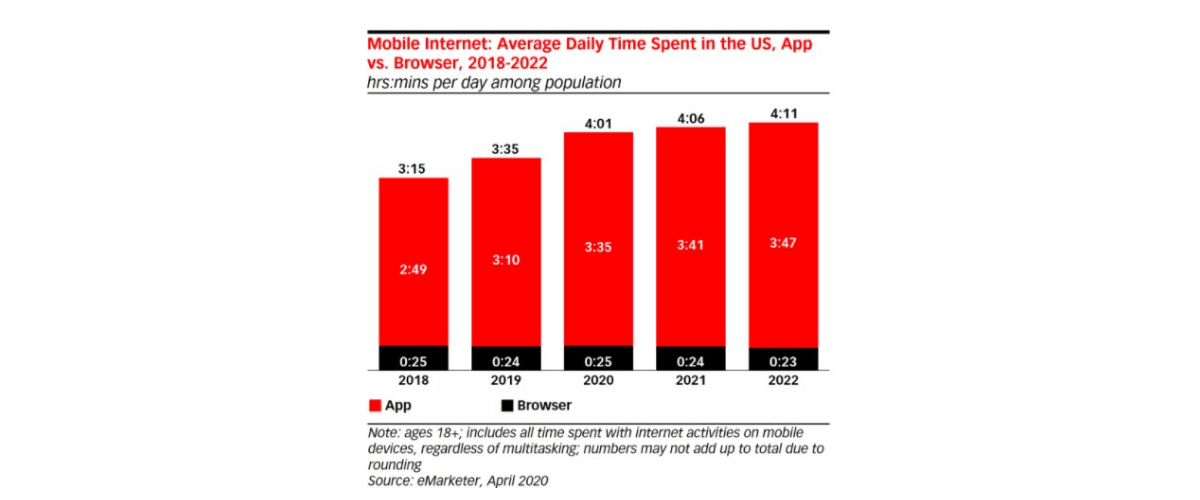
2. 90% of mobile internet is spent on apps, according to the data provided by eMarketer.
Not surprisingly, the gap between the amount of mobile internet and desktop internet is becoming wider and wider. eMarketer predicts that the next year an average adult mobile user will spend up to 4 hours a day with the gadget and almost 90% of the traffic will be poured into different apps, not in the old good browser. So the companies should not just work on the optimization but create high-quality apps for their business.
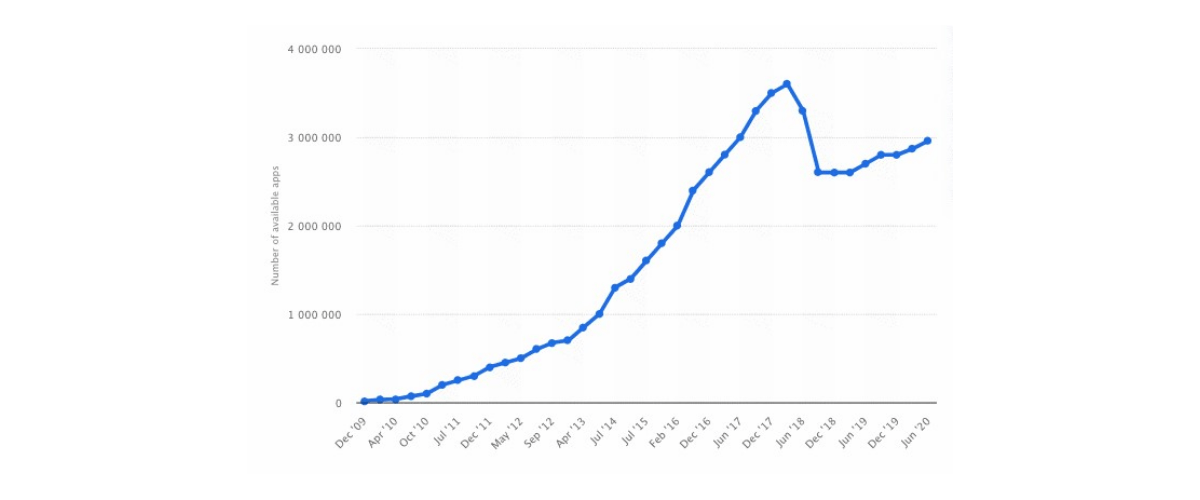
3. Almost 3 million apps can be downloaded in Google Play Store, as Statista claims.
In June 2020 there were almost 3 million apps published there and ready to be downloaded. Android OS leads the market globally, but the competition here is not that harsh as in Apple App Store.
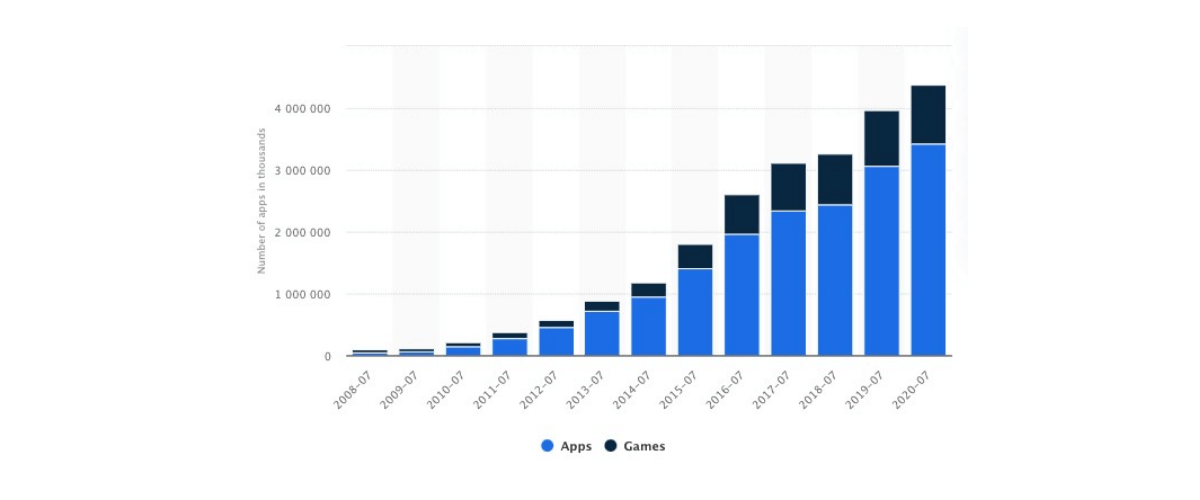
4. Apple App Store has 4.4 million apps (source: Statista).
There were 4.37 million apps in the Apple App Store published and ready to be downloaded and installed. The data, provided by Statists, shows an interesting twist - the rate of gaming and non-gaming apps here is 1:4, meaning that there are four non-gaming apps for one gaming.
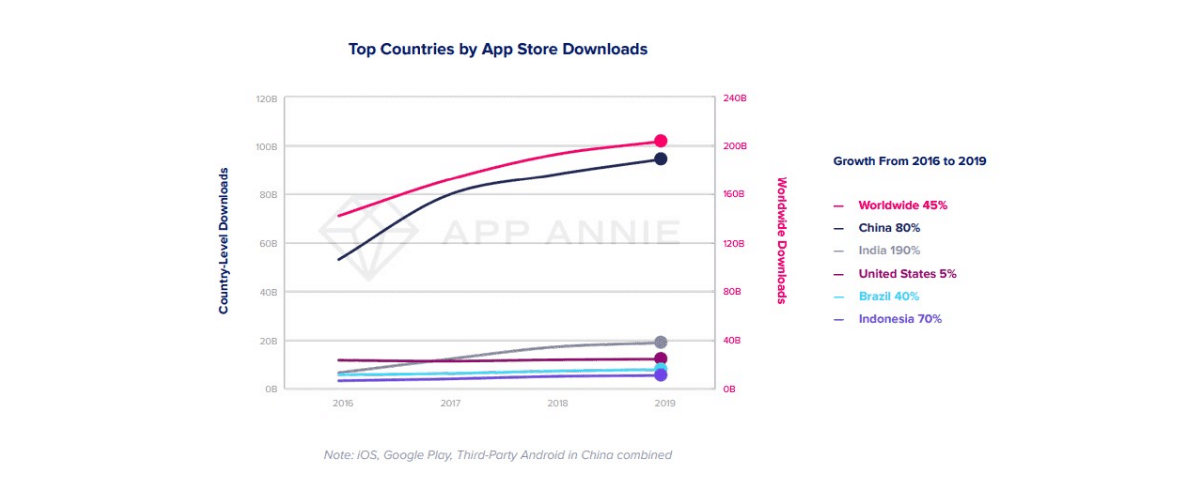
5. 204 billion apps were downloaded back in 2019 and the number is still climbing up (source: App Annie).
The number of downloaded apps increases year by year. In 2019 the worldwide figures hit the scores of 200 billion downloads. If they include re-installing and updating existing apps the amount will be even bigger. It is almost 50% increase, compared to 2016. Three years have passed and the real boom happened.
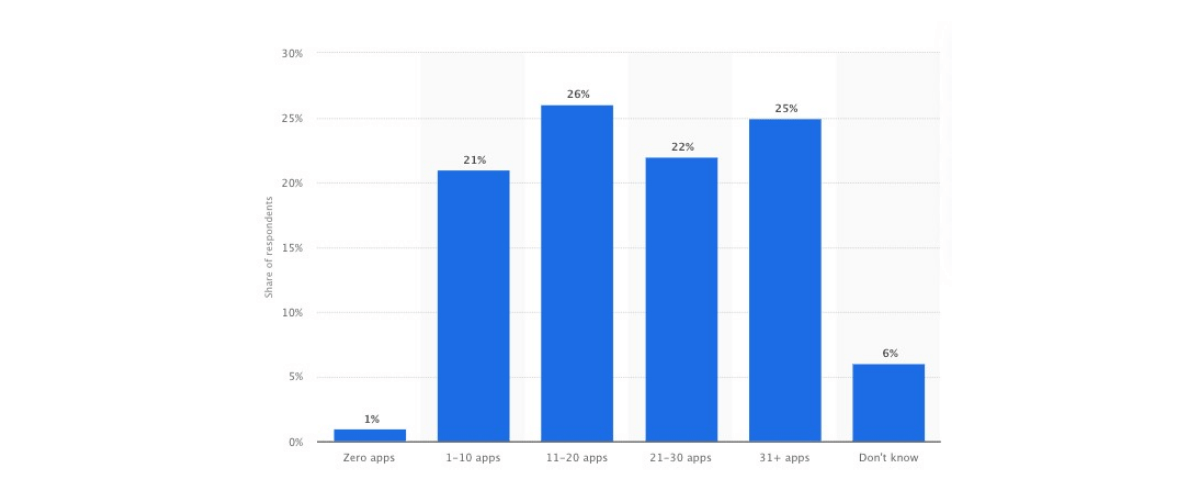
6. An average amount of installed apps per user is 10 (source: Statista).
Towards the end of 2019 the survey was conducted. It showed an interesting fact – almost ¾ of all the respondents said that they have around 11 apps installed on their phones. In the survey, they did not include the pre-installed ones, so just the apps downloaded by the user. Another interesting fact to consider that there’s not that many new apps to be downloaded. Instead, people tend to stick to some of them and use them for a long time. Note here that the number of downloads says almost nothing about the app’s success. If the user does not use your app on an everyday basis or frequently enough, it will soon be deleted. And here the next stat comes. See below.
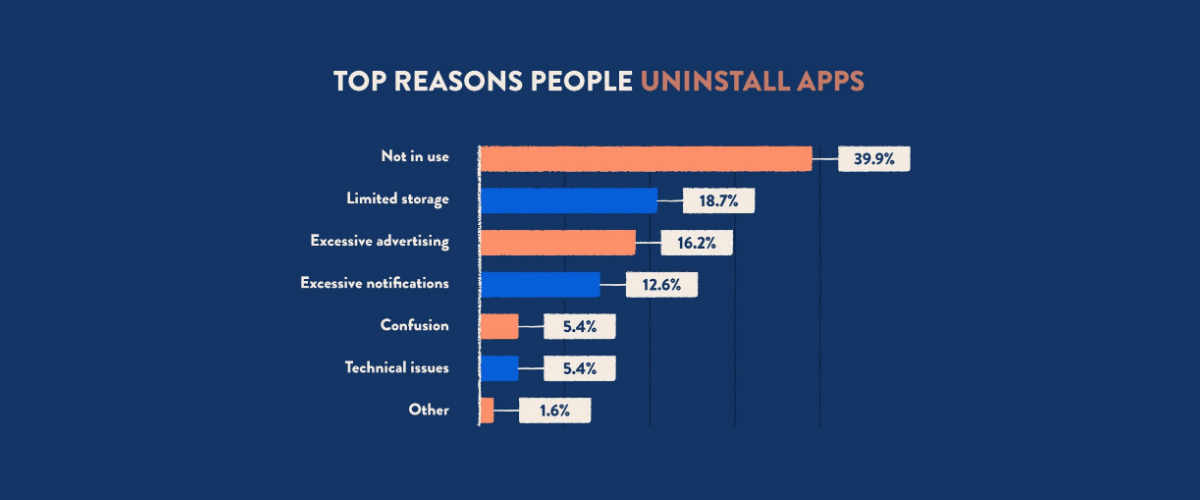
7. The TOP-1 reason why apps are deleted is not using them (CleverTap).
Ask yourself, how often do you clean the phone memory from the recent installed apps? The main reason why people do that is that these apps are not used. And here we come to a very important topic because it is essential for the business to know why exactly this or that all is not used. Another reasons are lack of phone memory, aggressive ads and annoying notifications. In general, all these reasons can be generalized and called simple – poor UX or user experience. So the failure depends mostly on the UX you provide.
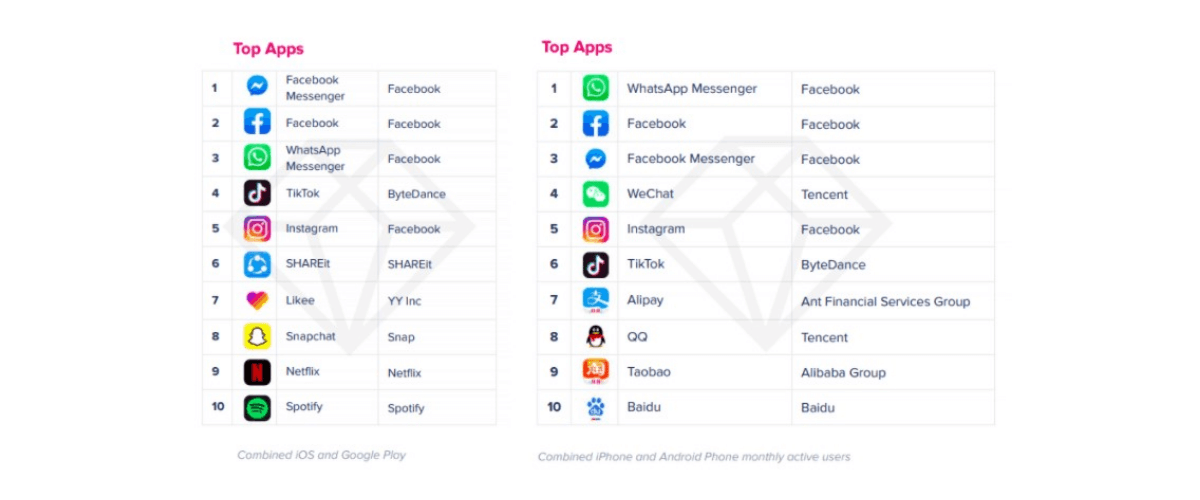
8. Facebook Messenger is the TOP app worldwide. WhatsApp, however, is the TOP-1 by active users (source: App Annie).
Yes, Google is huge, it is a giant, but yet Fb is winning 4 out of the 5 most downloaded and the most-used apps. Interesting, but quite logical fact is that all the TOP-5 apps are connected to social media and communication. It is absolutely in scope of the most popular app categories.
9. 20% of all the apps in the Apple App Store are gaming apps, and only 10% are business ones.
The most popular category for developers in the Apple App Store is gaming apps. And 20-25% of all the apps are in this category. The second highest category is almost twice smaller. So if you are focusing on the gaming app to launch, prepare yourself for tough competition. But the winner gets it all, so if you succeed, you will be on the wave of this booming industry.
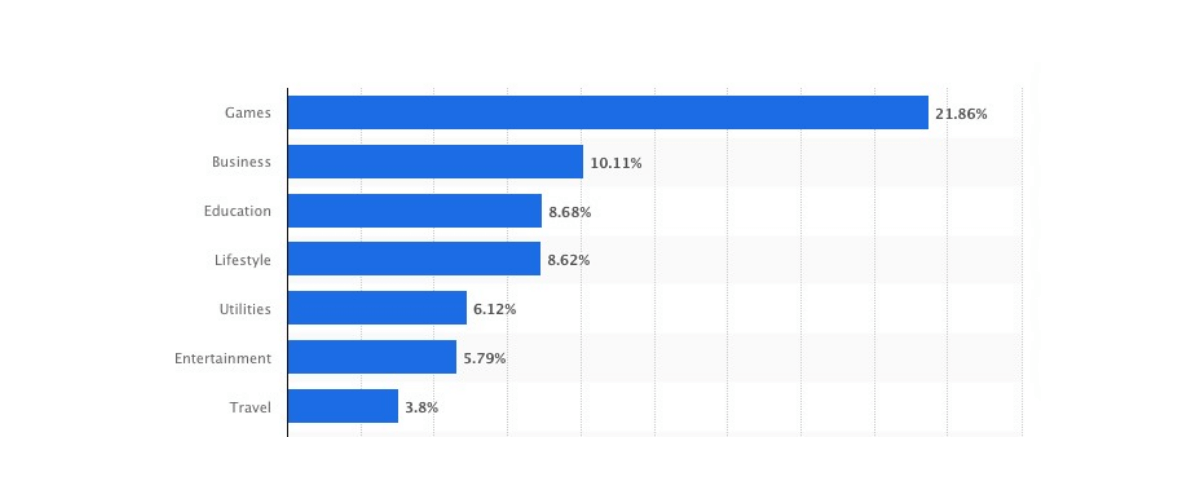
Source: Statista
10. Users spend half of their time in social media or communication apps.
Social media apps, communication apps, and so on are the most frequently downloaded ones, but also the most used. According to the research, people spend almost half of their time on the smartphone in these apps. Video and entertaining apps share the second place. TikTok, Netflix, and so on have more than 20% of the usage time. But as the example of TikTok shows, the line between these two categories is blurring, so youngsters use these apps for similar purposes.

Source: App Annie
11. Users launch music apps daily more than any other category.
Yes, users spend most of the time in social media apps, but at the same time, music apps are absolute leaders of launching attempts per day. On average people launch them three times per day. Users seem to log into Fb, Instagram and texting apps on an everyday basis, so the fact that music apps turned out to be launched much, much more often is the piece of data difficult to understand, so businesses should focus on it in the future to get the whole meaning of this data.
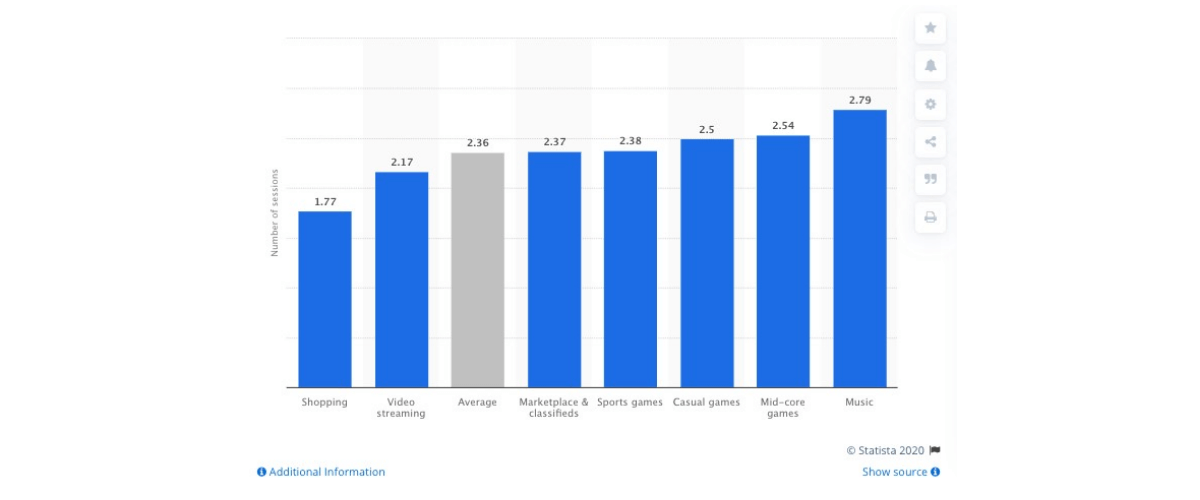
Source: Statista
Millennials & Gen Z App Usage Statistics
Not surprisingly Millennials and Gen Z turned out to be the most tech-savvy generations. And their purchasing power is growing. So while developing the app for these groups you should have a clear vision of what makes them push the buttons.
12. 70% of millennials most often use social media apps.
As the collected data shows, almost 70% of the millennials list social media apps as the ones they use most often. Messaging apps are in second place, and 55% of the respondents listed them as the most frequent ones. The reason is simple – people use apps for communication and social interaction. Consider these features and peculiarities if it targets this generation. They still want to be a part of the community, even if it is just the virtual one.
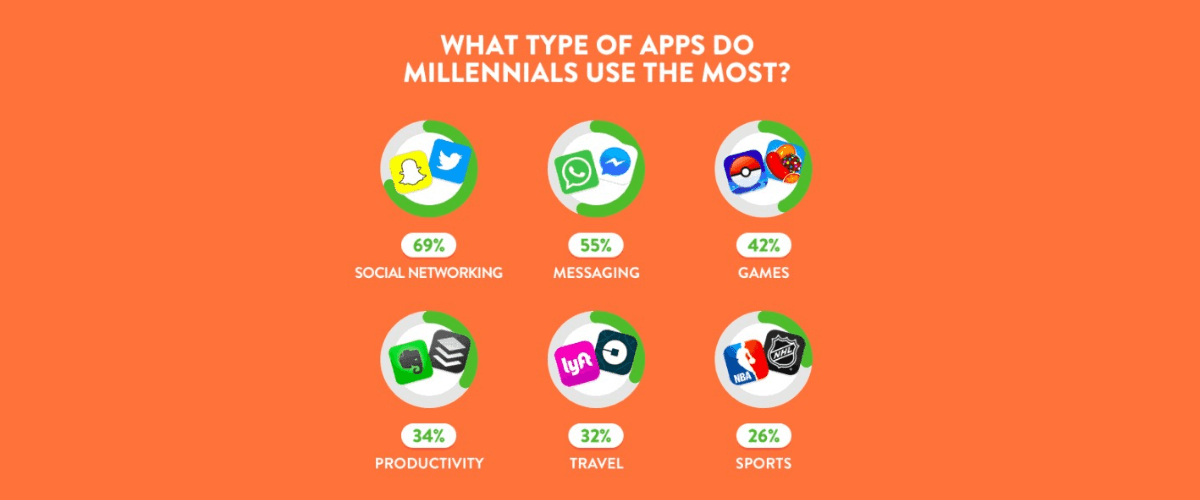
Source: MindSea
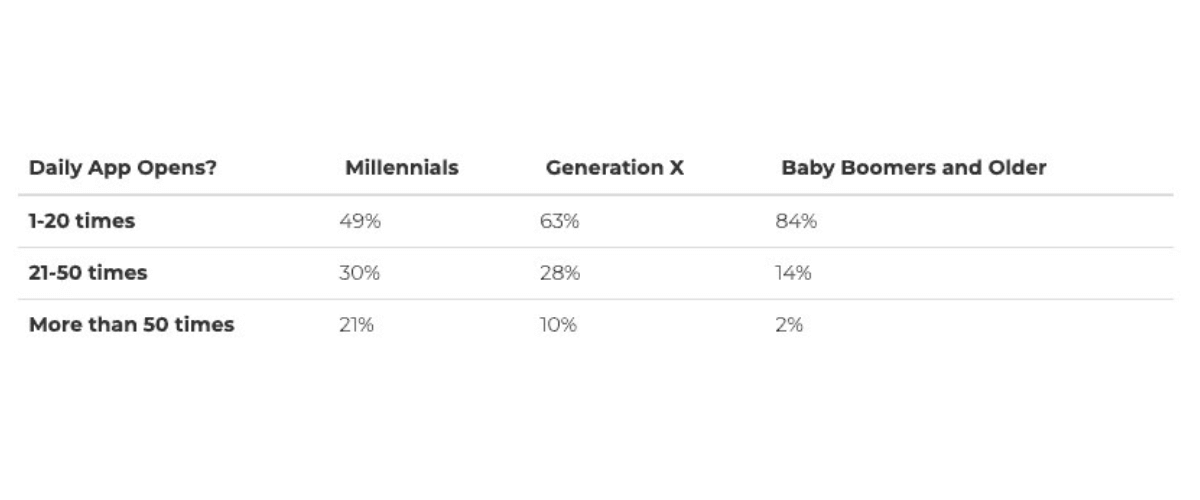
13. To open an app 50 times a day? Easy for millennials (source: The Manifest).
Millenials are the first generation who do not know about life without apps, so they open them around 50 times per day. Are you a part of the millennial generation? Try to calculate how often you open your mobile games, social media, and texting apps. We are sure it’s easy to score somewhere around 50. Young generations are always on their phones, all their lives are literally there, so create a great app, increase loyalty, provide good user experience and they will come back again and again.
14. Gen Z spends 71% of their digital media time using smartphone apps (source: ComScore).
Youngsters between 13 and 24 are the savviest generation ever and spend most of their time in apps. They do hold the crown for not just the number of sessions but for the total time spent per month. Soon they will surpass the millennials as the largest generation so it makes them the perfect target audience for almost any mobile app. So this news is good for you even if they look a bit drastic in general.
Mobile App Revenue Statistics
Let’s round out this chapter of the article with some insights. You need to know some essential points if you are about to monetize the app you develop.
15. 92% of apps in the Apple App Store are free.
The market is dominated by free apps. Freemium and free apps worked their way perfectly across the market. They also dominate in every single app category. They still make money on add-ons, ads, and updates, but charge nothing to be downloaded. This model turned out to be the most profitable after all.
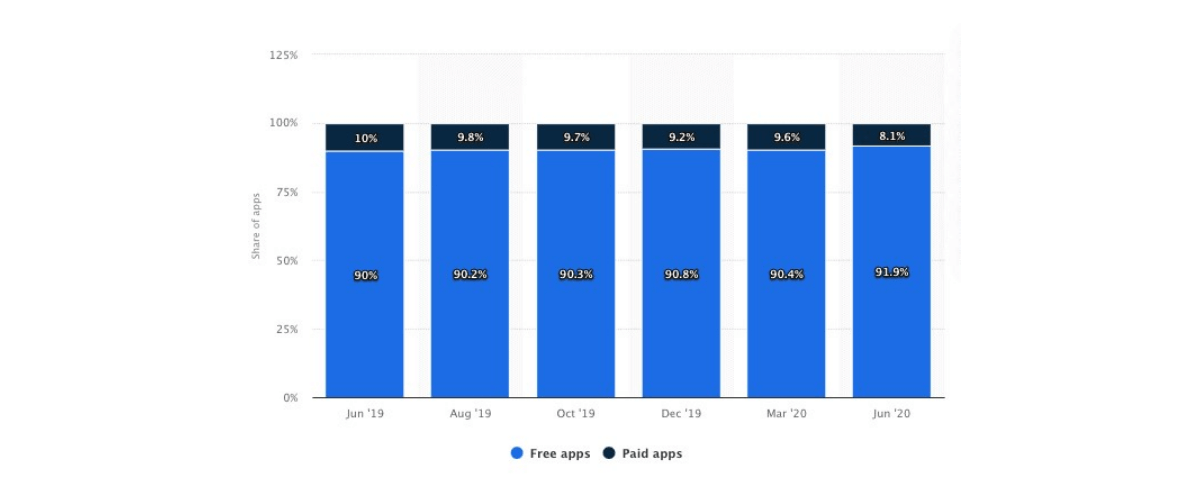
Source: Statista
16. 96% of apps in the Google Play Store are free.
Google Play has more free apps than Apple App Store, and the figures are around 96% in total.
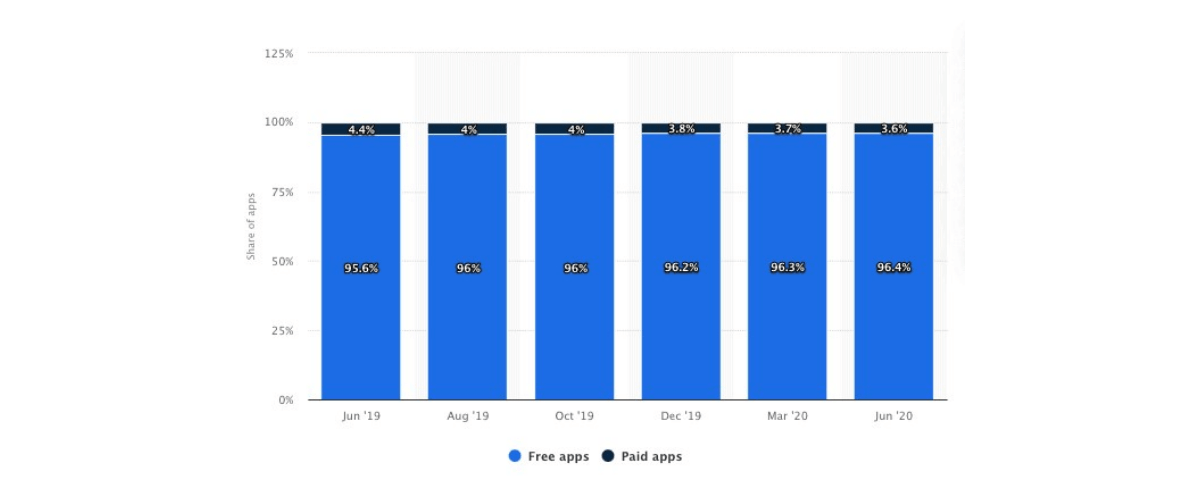
Source: Statista
17. In 2020 mobile apps will make $581.9 billion in revenue according to the prognosis.
The mobile app market is hot. It is extremely hot and will be hot for the next decades. The revenue is rising and the decay is not even visible in the nearest future. And in the future in general. So the revenue is projected to be around $1 trillion in 2023. Get into action when it’s just time.
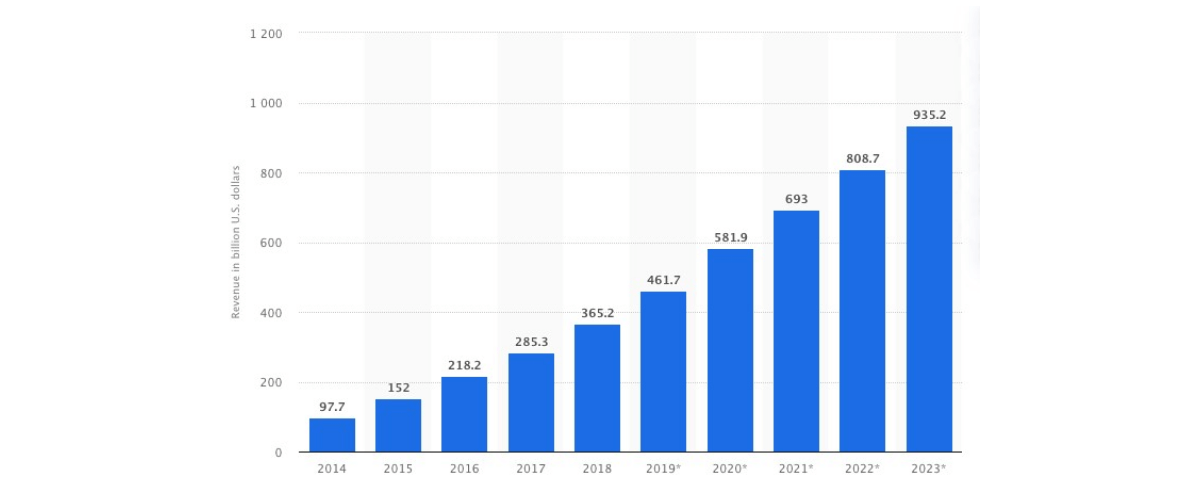
Source: Statista
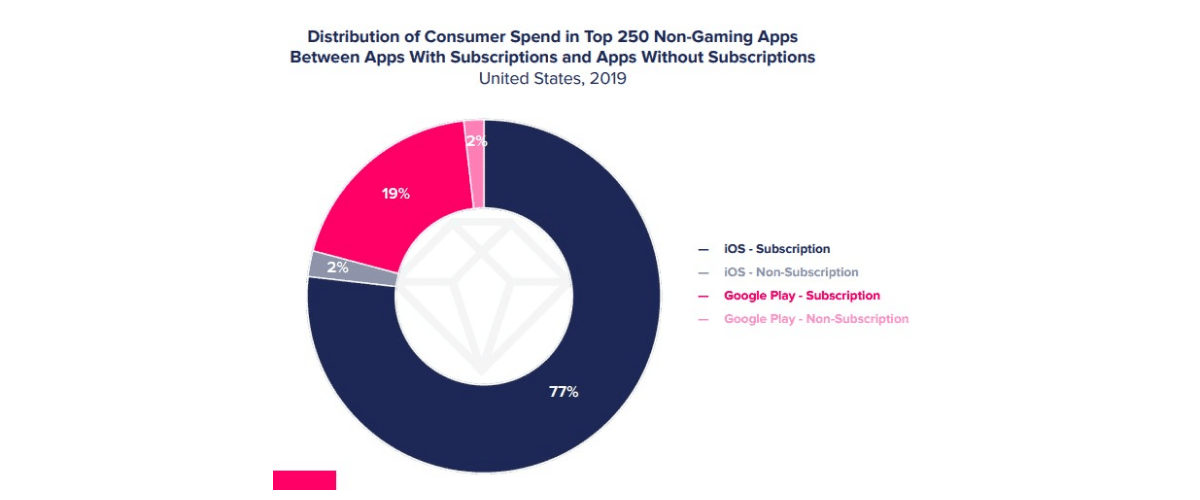
18. Most apps with subscriptions, gaining the most revenue, are not the gaming ones.
Subscriptions contribute the most to the mobile revenue in the US and worldwide. 97% of the money consumers poured into the apps came from subscriptions, and the apps were not gaming ones. For Google Play Store the figures are a bit lower but the general view is the same – 91%.
Source: App Annie
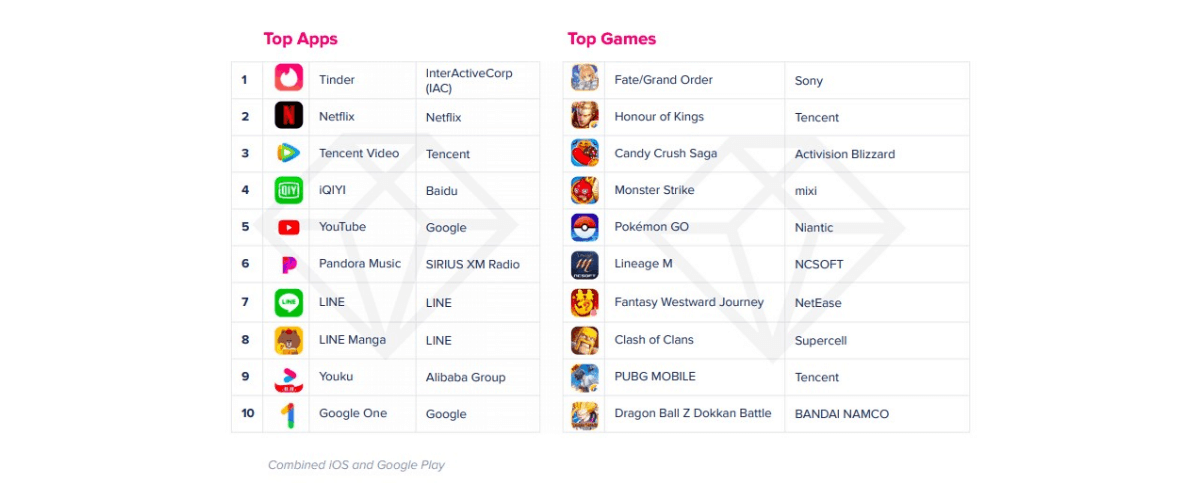
19. Consumers spend the most on video apps.
In 2019 4 out of TOP-5 non-gaming apps where consumers spent most were video apps. Video is the fastest-growing content and it is not going to fade away. This content type is popular for subscriptions and drives a great chunk of revenue. And apart from the apps, outside the mobile world, video content becomes more and more popular across the industries in general. To add some video content to your app will be a good idea.
Source: App Annie
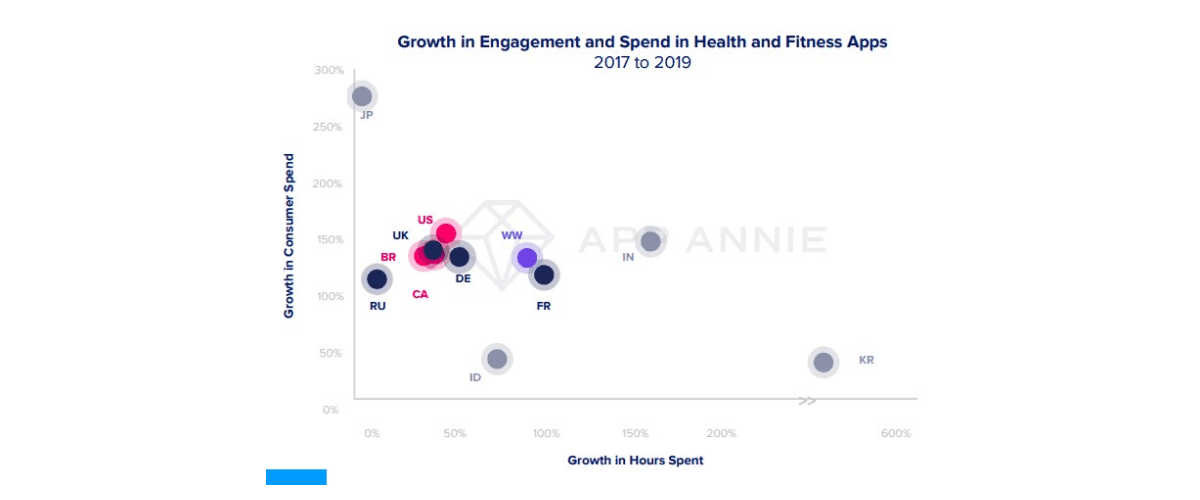
20. Consumers spent 130% more on health and fitness apps in 2019 than they did in 2017.
Since the pandemic broke, people started to explore alternative ways to keep fit and be in shape. So here the fitness and wellness apps come into view. The number of fitness apps downloads increases almost a half year after year. But in 2019 the figures are even more astonishing – 130% compared to 2017. And if everything goes as it does in the future (and it, most likely, will), 2020 and 2021 will be the most profitable years for the health and wellness apps market. So if you are a part of it, create an app and gain a profit.
Source: App Annie
The time is yours
We do hope this article helped you to determine the direction to move to and the key point you have to consider while building your own app. However, the better you know your target audience, what people do, and how, the higher chances that your app will become the new TikTok.
If you are looking for a reliable partner to help you drive business value with a strong mobile strategy, we are here to help. Schedule a free call and one of our strategists will get in touch with you.
By the way, which chart turned out to be the most surprising one for you? Feel free to share!