Top 5 JavaScript charting libraries overview
Whatever we do, we all work with data. It is crucial that we interpret it in the correct way in order to gain the maximum value out of it. As well, understandable representation of the data is a must for every modern customer of every digital tool, is it a simple web app or a complex business management software.

Middle East, and especially UAE are going digital very fast, and medium and big business managers are demanding the information to be represented graphically, clear and simple, to analyse it fast and precise.
Most often customers needs charts and diagrams. Customers love (!) when they are dynamic, beautiful and represent all the data they need. And sometimes it’s very difficult, but still very important to pick the right solution.
So in this blog post we will have a look at a number of JavaScript charting libraries we often use, and try to compare them.
In general, a good charting library has to have good performance, be easy for implementation, highly customizable and of course have some aesthetics. We chose top-5 libraries that are worth your attention.
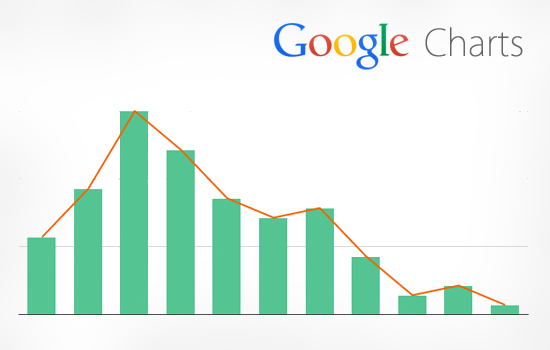
1.Google Charts
It’s an open-source library that allows to create various charts in an easy way.
Google Charts has expansive chart gallery, an array of customization options and also a lot of detailed instructions and commented code.
One of Google Charts benefits is that it’s very user-friendly: you don’t have to be a JavaScript guru in order to create complex charts. Another advantage is that this library allows its users to configure the charts in such way that they smoothly blend with the overall webpage appearance.
We started with Google Charts not because it’s the best, though for sure it has it’s benefits. We started with it because this library is great for both beginners and senior developers and is overall used by great number of people in the world, as well as in Middle East and Dubai.
You can check Google Charts official website or github page
2.Echarts
This is a Chinese product but extremely high quality – and unlike some other Chinese solutions, it has all necessary documentation in English. It’s code-free and it has a feature that makes it stand out.
Echarts allows users to manipulate data in real time with drag-recalculate feature, meaning you can drag a piece of data from one chart and drop it into another and have charts recalculation in real time mode.
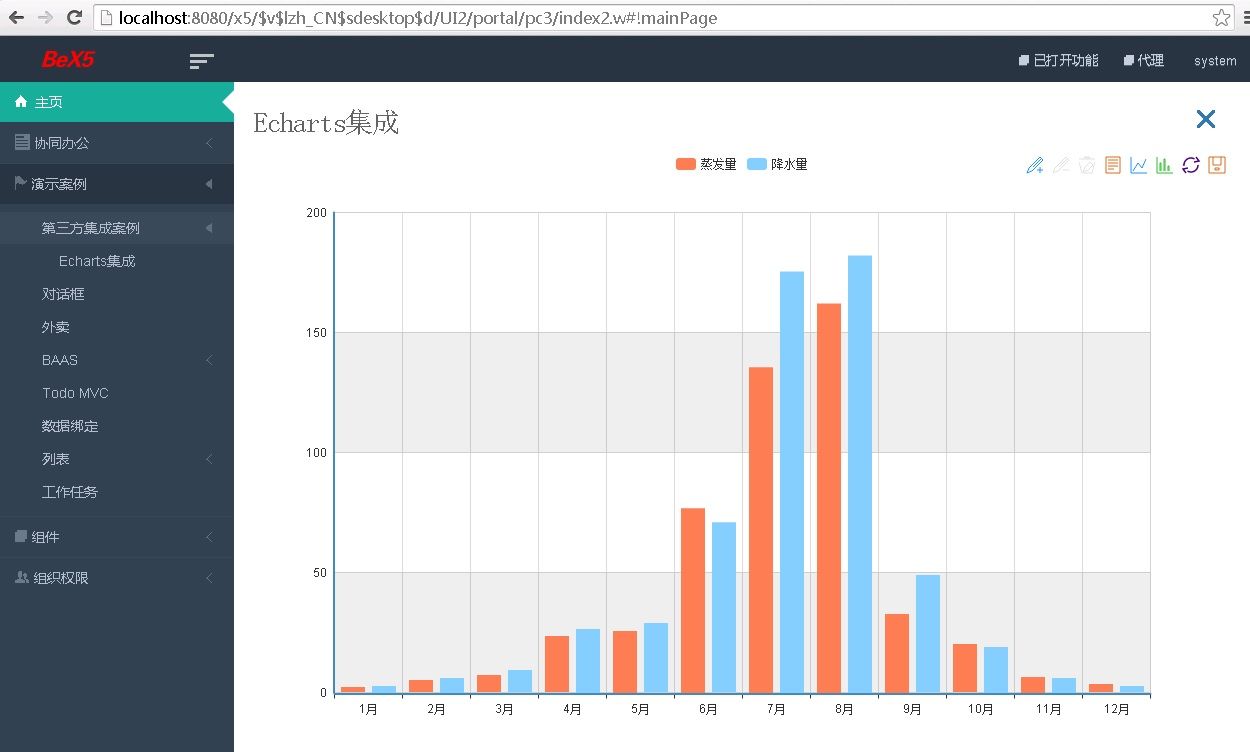
Baidu’s creation is also intended for work with big data, which makes it even more awesome and suitable for complex big data management software for huge companies.
Oh, yes! Important to mention the fact that it was written in JavaScript only – while many other libraries were ported to it. Echarts is a great tool for creating highly customizable and interactive charts.
Cleck here to check Echarts website or github page.
3.Chart.js
The library that can make a customer happy!
Even though it’s positioned as simple, this library is highly user-friendly and enables developers to create interactive and customizable charts.
This library is great for beginners because it has tutorials and well-written documentation on official page and it’s easy to set up.
On one hand, this library is fancy, and sometimes really fits the customers expectation as well as it rather light-weight in comparison to other libraries, but on the other, it has quite limited customization options.
However, it has its valuable features (data animations, data transitions, logarithmic functionality) and, depending on your project, can be a really suitable choice for you.
Read more about Chart.js on their official website or check the github page.
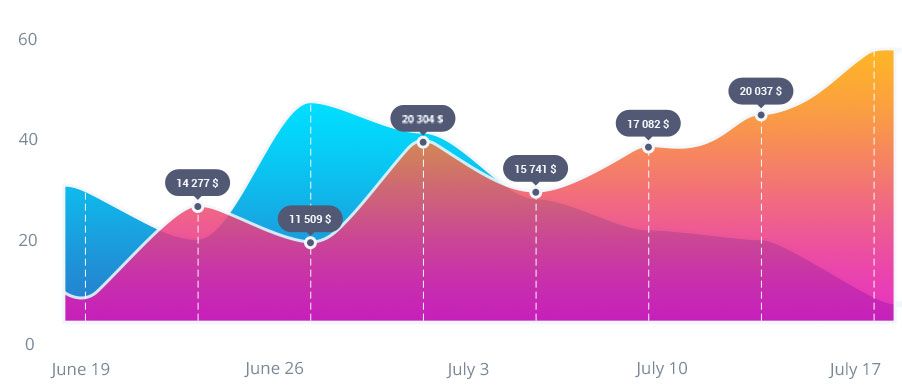
4.Chartist.js
This one is a choice of creative developers who are looking for beautiful and reader-friendly charts.
This open-source library is also a light-weight one and supports custom animations. Chartist offers impressive choice of charts and utilizes SVG for chart rendering.
Chartist is relatively easy to configure and can be easily customized with Sass. However, it’s not able to mix chart types and does not support old browser versions.

Still, this library is worth a try because the result will wow you and in addition it also has quite good community support.
However, there’s a tricky situation had being noticed by us: from our experience, people in Dubai LOVE wow factors! Let’s be honest, we all do. But at the same time for some reason, we often see old browsers being in use overall in the Middle East. That makes even more important to understand the app audience before picking up this library.
They have a very full and interesting description on their page.
You can also check the github.
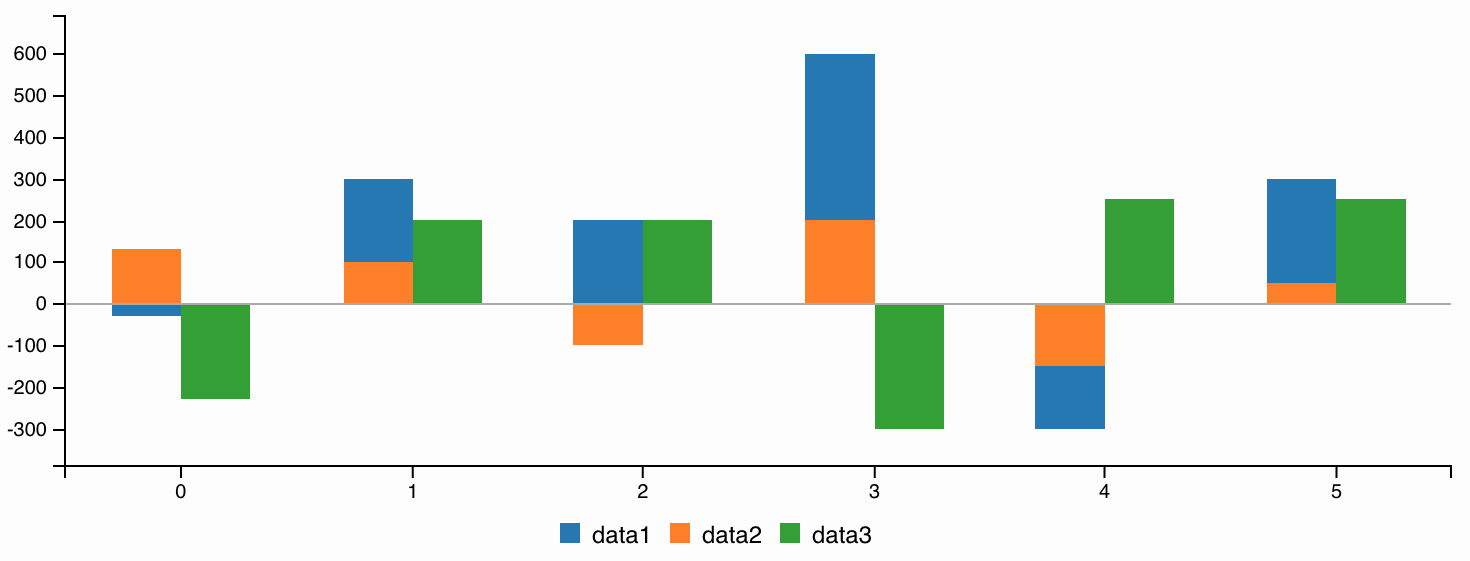
5.C3.js
On the other hand we have C3.js
It is a D3-based library and due to D3 wrapping, the users do not have to write any D3 code.
C3 is light-weight, can be used with any front framework and has nice compatibility across browsers. Even though the charts within this library are not so complex as sophisticated they are incredibly clean and functional.
This library may seem difficult at first but it has good documentation and once you get an understanding of it, you’ll see all the pros of using C3. In addition, with C3 you can create reusable charts and update them after the first rendering.
To discover more, check C3.js official website and github page.

You think we missed any worthy charting library?
Off course we did!
There are also beautiful ‘Tau Charts’ which is one of the most flexible, a lightweight ‘highcharts’,
build with React ‘Recharts’, advanced ‘NVD3’, old but still great ‘Flot’, and many more.
Comment below and let us know what is your favorite Javascript charting library!